It would be nice to think we’re all invincible when we sit behind the wheel of a car, but the reality is that it’s simply not the case. We’re all guilty of going just a little too fast, of taking the corner just a little too sharp, and not paying enough attention to interactions.
Most of the time, these errors or deliberate acts are harmless – but sometimes, they can have devastating consequences.
What Are the Odds of Crashing in a Car?
Unfortunately, no matter how safe or conscientious of a driver you might be, there is always a risk of getting into an accident when you climb behind the wheel.
In fact, a recent report by Esurance found that more than three-quarters (77%) of all drivers have been in at least one car accident. Your chances of being in a car accident during a 1,000-mile trip are about 1 in 366.
Seeing those statistics, it makes sense as to why car insurance rates are so high and why lawsuits and lawsuit loans, too, are reaching all-time highs. Just about all of us will be in at least one minor car crash in our lives, no matter how hard we work to avoid it.
How Many Motor Vehicle Deaths Occur in the United States Each Year?
According to the National Safety Council, your odds of dying in a motor vehicle crash are about 1 in 107. If those odds sound a bit too high for your liking, know that you’re much more likely to die from things like heart disease, cancer, suicide, or opioid overdoes. Most of these deaths are preventable – and in most cases, deaths related to motor vehicle accidents are, too.
The deaths aren’t evenly distributed among demographics. Young adults and teenagers, those aged 16 to 24 years old, are the most likely to die in motor vehicle accidents. Motor vehicle deaths are the number one cause of death for this age group, coming in at about 48.5% of all deaths (the next most common cause, homicide, is only 15.2%).
Individuals who are aged 15 to 20 years old constitute less than seven percent of the total driving population yet are involved in 20% of all crashes and a whopping 14% of all deaths. 65% of teen passenger driving deaths occur when another teenager is driving with about half of teen car accident deaths involving just one car. These statistics are all courtesy of the Safe Roads Alliance, Inc.
Which State Has the Highest Rate of Vehicle Crashes?
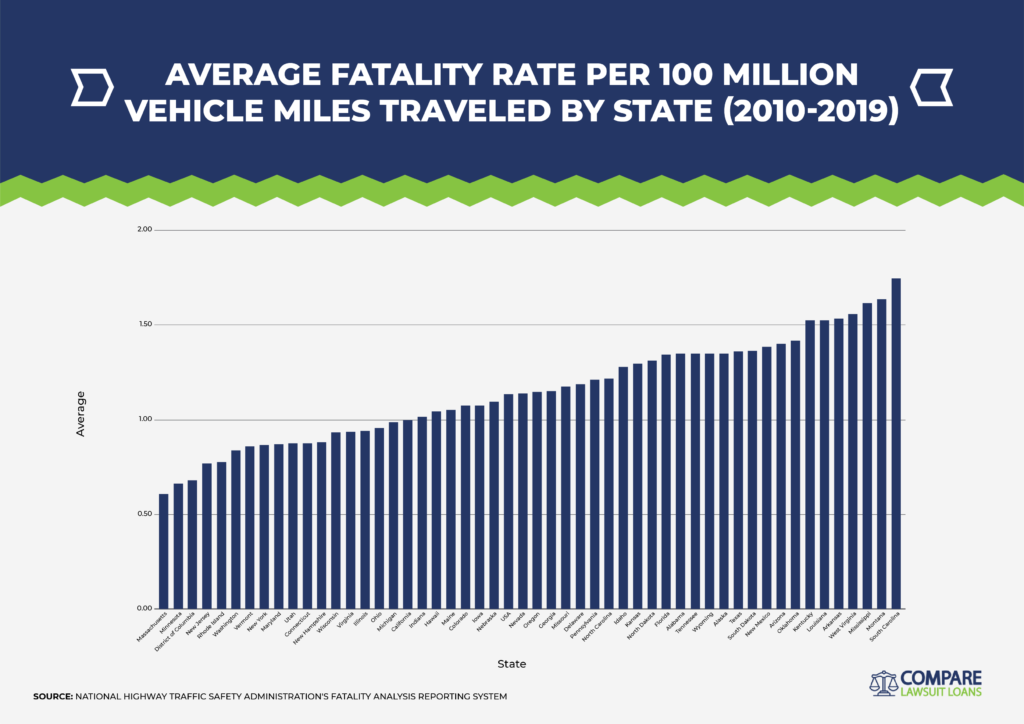
Vehicle crash rates are not evenly distributed around the country. In fact, some states have significantly higher rates than others.
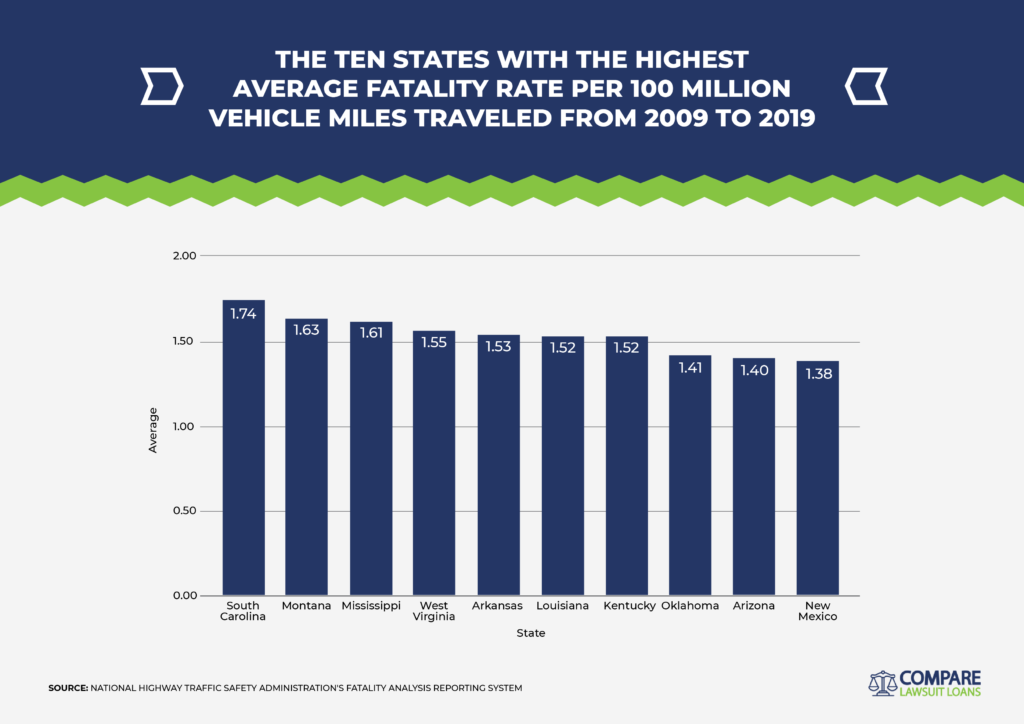
The states with the highest average fatality rate per 100 million vehicle miles traveled (with data taken from a period of 2009 to 2019) include:
- South Carolina (1.74)
- Montana (1.63)
- Mississippi (1.61)
- West Virginia (1.55)
- Arkansas (1.53)
- Louisiana (1.52)
- Kentucky (1.52)
- Oklahoma (1.41)
- Arizona (1.40)
- New Mexico (1.39)
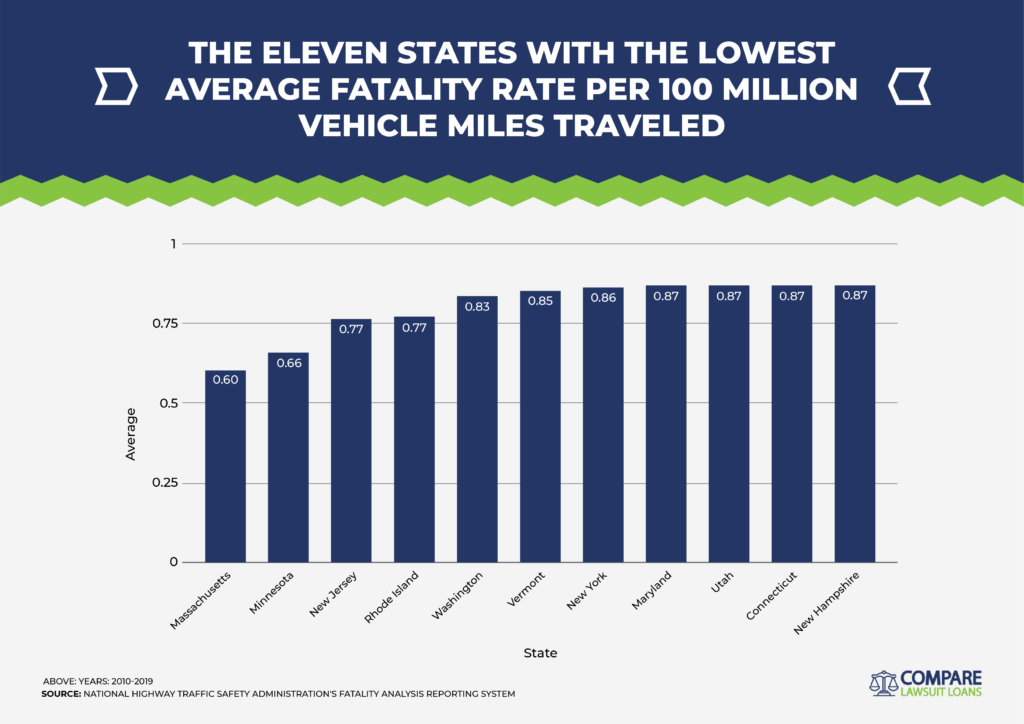
On the flip side, the states with the lowest rate of mortalities include:
- Massachusetts (.60)
- Minnesota (.66)
- New Jersey (.77)
- Rhode Island (.77)
- Washington (.83)
- Vermont (.85)
- New York (.86)
- Maryland (.87)
- Utah (.87)
- Connecticut (.87)
- New Hampshire (.87)
What is the Number One Cause of Motor Vehicle Crashes?
The number one cause of motor vehicle crashes is distracted driving, but it’s certainly not the only culprit. We’ll break things down a bit further.
Distracted Driving
About 77% of all traffic accidents are due to driver error. Unfortunately, the vast majority of these are preventable and related to distracted driving.
Distracted driving includes things such as:
- Talking or texting on your phone
- Eating
- Grooming
- Reading
- Applying makeup
Substance Abuse
Driving under the influence is another leading cause of motor vehicle accidents. Although we pay the most attention to driving under the influence of alcohol – which caused a total of more than 66,488 crashes in 2019 alone – other substances should be noted as well.
These include substances like narcotics and marijuana as well as the ones we don’t really think twice about using, like allergy medications, cold medicine, or prescriptions.
Speeding and Reckless Driving
Speeding could be considered an example of driver error but it leads to so many crashes that it’s worth mentioning on its own. Other examples of reckless driving that contribute to car accidents include excessive lane changes and following too closely.
In fact, speeding was a factor in more than a quarter of all traffic fatalities in 2019, killing more than an average of 25 people every single day, according to the National Safety Council.
Poor Road Conditions
There are other factors that contribute to motor vehicle accidents, too, though these factors tend to be more related to and not causative of accidents or deaths.
States with the worst roads are those that have a lot of potholes, poor street signage, and heavy traffic. Those with the best roads have smooth pavement, frequent repairs, and minimal debris.
The states with the best roads, according to Consumer Affairs, include:
- Wyoming
- Kansas
- Minnesota
- South Dakota
- Montana
- Oregon
- Washington
- Utah
- Vermont
- Idaho
Those with the worst are:
- South Carolina
- Louisiana
- Hawaii
- Rhode Island
- Delaware
- Oklahoma
- West Virginia
- Mississippi
- New Mexico
- Michigan
- California
Weather
Weather, particularly winter weather, plays a major role in motor vehicle fatalities, too.
The deadliest states for winter driving include Michigan, Pennsylvania, New York, Ohio, and Illinois, which together account for 36% of all winter driving fatalities, according to Value Penguin.
It’s not just snow and ice that can wreak havoc on the roads either. In 2019, 2569 crashes were attributed to rain, while only 440 were connected to snow and sleet.
Of course, this doesn’t account for the fact that many US states included in the data do not receive much, if any, annual snowfall, but it’s still important to recognize that rain can be incredibly dangerous, too.
Time of Day
Most car accidents occur in the late afternoon and evening. The most dangerous times to be on the road are between 6 pm and 9 pm, with the bracket between 3 and 6 and then 9 and midnight being almost equally as dangerous.
The safest time to be on the road, according to the National Highway Traffic Safety Administration? From 3 am to 6 am.
Time of Year
Believe it or not, the time of year can play a role in motor vehicle crashes even when inclement weather is not a factor.
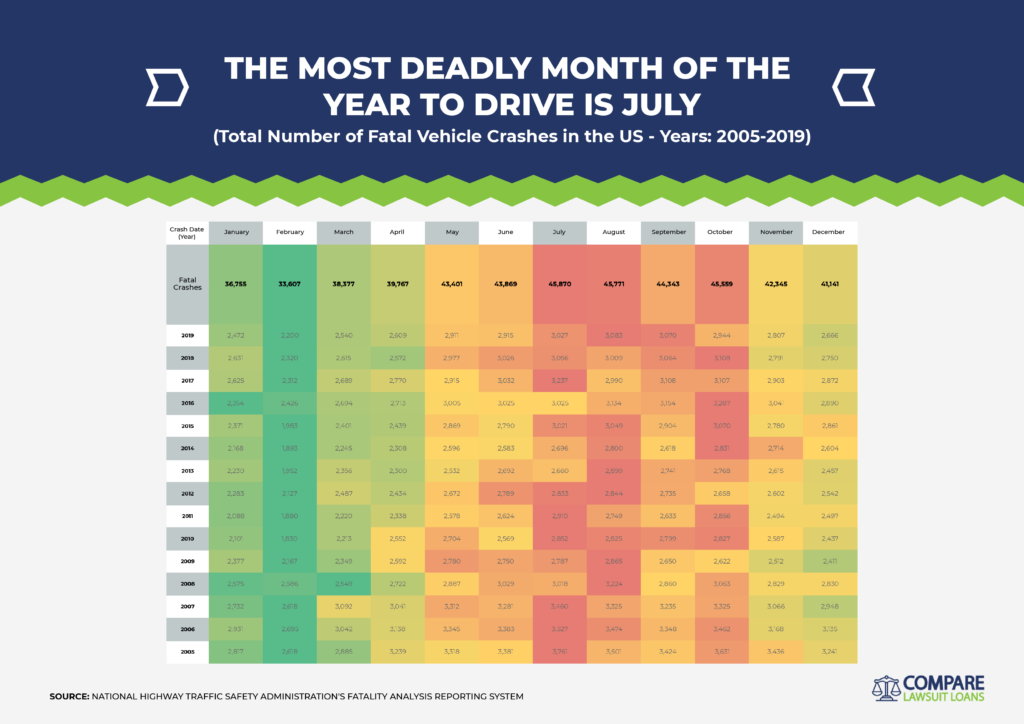
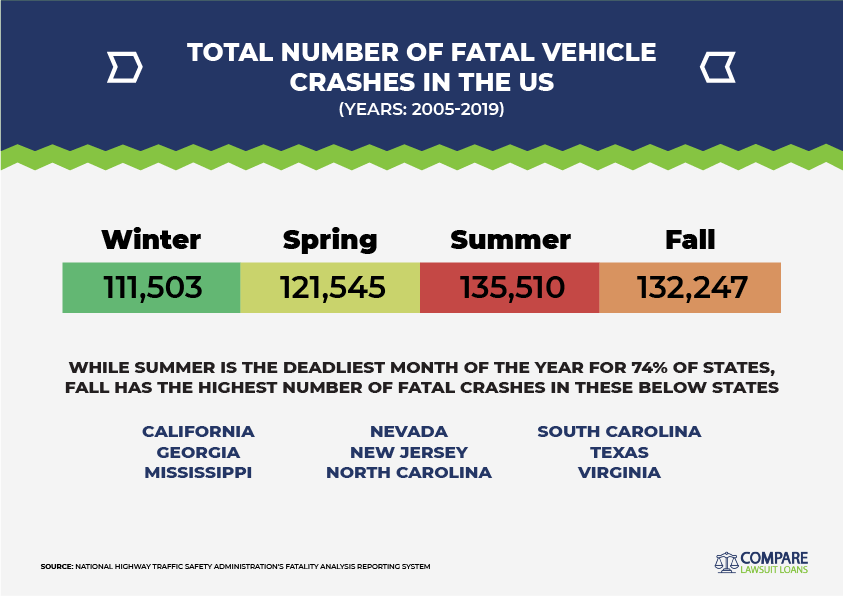
According to NHTSA FARS data collected from 2005 to 2019, the deadliest month of the year to drive is July. This is followed closely by August and October. These are months when inclement weather isn’t likely to be a factor – so what gives?
It all has to do with how many drivers are on the road. Two of the biggest travel holidays, Labor Day and Thanksgiving, have some of the highest rates of fatalities. 62% of people plan road trips in the fall, according to AAA, which is part of the reason why October ranks so highly in terms of fatal crashes – there are more drivers on the road.
In fact, the average American is doing about 30.6 miles of driving per day during the summer months.
Keep in mind, too, that summer and fall holidays not only lead to more cars on her pad but also become deadly because more alcohol tends to be consumed on these holidays. That makes a lot of sense when you realize that most motor vehicle fatalities occur on Fridays, Saturdays, and Sundays as opposed to during the week.
February is the safest month of the year to drive. Surprisingly, the winter months tend to be safest, not necessarily because we are outstanding winter drivers but because there are simply fewer cars on the road.
Although summer tends to be the deadliest month of the year to drive in about three-quarters of all states surveyed, fall is the most dangerous for the following states:
- California
- Georgia
- Mississippi
- Nevada
- New Jersey
- North Carolina
- South Carolina
- Texas Virginia
Risk-Taking Behaviors
Some interesting research came out of motor vehicle studies conducted at the height of the COVID-19 pandemic. Despite the fact that there were far fewer cars on the road in the spring of 2020, traffic fatality rates increased by 30%.
Evidence from the National Highway Traffic Safety Administration suggests that this was due to an increase in risk-taking behaviors such as driving impaired, speeding, and not using seat belts.
Why Does This Matter?
Knowing the risk of being on the road is important if we want to keep ourselves safe. While it can be depressing to look over the statistics, knowing what poses the greatest threat to our safety and how we can mitigate those threats is essential.
It’s not all grim news either. In fact, several states have made great strides in reducing their average fatality rate per 100 million vehicle miles traveled.
These states include:
- Mississippi
- Nevada
- Utah
- Arkansas
- South Dakota
States with the least amount of improvement include Rhode Island, Delaware, Oregon, Connecticut, and North Dakota.
In some states, like Mississippi, fatalities are still high but are on the downswing. Much of this is due to increased public safety messaging, increased law enforcement and seat belt regulations, and improved road conditions.
Most places are making big strides in improving motor vehicle safety. Between 1975 and 2005, it is estimated that seat belts saved 211,128 lives. All states have safety belt use laws in effect. Other improvements have been made in reducing the motor vehicle mortality rate, too, including the use of rear-facing car seats with young children, heightened penalties for impaired driving, and more.
Tips for Avoiding Auto Accidents
With that data in mind, here are some tips to help you stay safe on the road.
Be a Good Driver
Even though you might not be planning on taking a road test any time in the near future, brush up on some tips for safer driving:
- Use the 9 and 3 o’clock hand positions for smart driving
- Maintain a speed appropriate to laws and road conditions
- Maintain three seconds’ worth of distance between your car and the car ahead of you
- Fasten your seatbelt (and make sure your passengers have done the same)
- Get rid of distractions like cell phones and music
- Remove impairments like alcohol, drugs, and sleep deprivation
Drive a Safe Car
Sometimes, car crashes can be blamed just as much on the car as they can on the driver or the road conditions. Here are a few simple guidelines. Make sure your car has:
- A low center of gravity and good tires
- Snow tires in the winter if you receive regular snowfall
- Tread depth not less than 1/16” and tire pressure at the appropriate PSI
- Wipers on when the headlights are on
- Inspections that are up to date
Public Safety Messaging
If you’ve ever driven past those flashy billboards encouraging drivers to slow down and buckle up, you might have found yourself rolling your eyes. “Obviously,” you think. “I don’t know why they need to tell us that.”
However, there’s a lot of evidence to suggest that those seemingly redundant messages actually work. The NHTSA studies regarding high pandemic car crash rates suggest that a decrease in public messaging during this time – when safety messaging focused more on the spread of COVID-19 – led to an increase in crashes.
The bottom line here is that public safety messaging works – and it’s important in reducing the number of motor vehicle crashes.
Conclusion
Keeping apprised of the latest motor vehicle crash statistics is important if you want to stay safe on the road. While there’s still work that needs to be done, recent trends suggest that states and other regulating bodies are moving in the right direction to keep our roads safer.